There are some great JavaScript libraries available for adding charts to websites. Most make use of the HTML5 canvas supported in all modern browsers. Using third party libraries we can quickly add great looking charts to represent our customers data. Here’s an example of some of our charting in action.
Sometimes however we’re asked to create something a little more bespoke which may not be supported by a third party library so we have to create our own. Here’s how we do it.
The HTML5 <canvas> element allows dynamic rendering of 2D shapes directly onto the browser. To use simply setup a canvas, setting its position and size on a webpage and use the Canvas 2D API to draw your chart.
<canvas id="chart" width="150" height="150"></canvas>
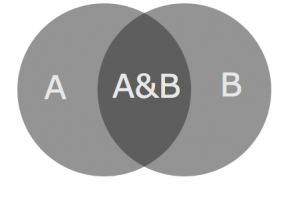
Let’s say we want to create a simple Venn diagram.
Using JavaScript we can easily create a filled circle.
var canvas = document.getElementById('chart');
var context = canvas.getContext('2d');
context.beginPath();
context.arc(x, y, radius, 0, Math.PI*2, true);
context.closePath();
context.fillStyle="rgba(40, 40, 40, 0.5)";
context.fill();
I’ve chosen a colour (well a grey) with an alpha value of 0.5. When we overlay the second circle of the Venn on top of the first, the two alpha values combine to form the overlapping shade.
Add some labels and we’re done.
context.fillText(“label”, x, y);Using HTML5’s canvas we can easily start to create our own bespoke JavaScript library to create charts exactly how our customers want them.


Recent Comments